
The following is courtesy of Professor Robert Stone, who led this project for VR Solutions/Virtual Presence in the mid 1990’s.
English Heritage: Virtual Stonehenge
“…the largest and most challenging PC-based heritage reconstruction carried out to date”
Virtual Heritage Conference & Exhibition, December 1996
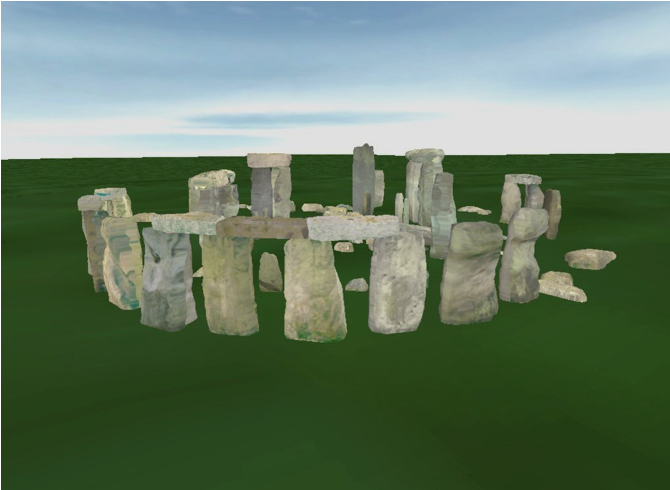
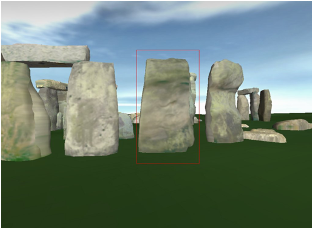
In 1995, English Heritage completed the most intensive survey of the Stonehenge area ever undertaken, generating a large database of information. It is the nature of databases that, whilst they contain much information that is significant or useful, this information is difficult to differentiate. English Heritage saw VR as a possible solution to their problem. The brief to VP Group was to produce a high quality and accurate record of the stones and their environs in their present state. Whilst not designed to replace the real experience, the visualisation was to be detailed enough to allow people to “walk” amongst the stones and inspect the different textures in 3D – something the general public is no longer allowed to do.
During the initial project review stage, Intel Corporation (UK) approached English Heritage with an offer to co-sponsor the Project, through their Community Liaison Programme. In conjunction with Intergraph (UK), Intel selected the Pentium Pro-based TDZ/GLZ
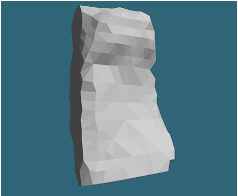
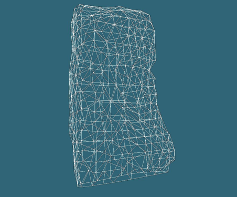
Workstation series, on which the model was to be developed and finally demonstrated. Before the team could begin the time-consuming process of inputting all the information from English Heritage’s digital survey into Sense8’s VR package, WorldToolKit, a surface representation of each stone was manually built up from point data extrapolated from hundreds of stereo photographs. Around 60,000 points made up each of the 80 or so surveyed stones. This figure had to be reduced to allow real-time rendering to take place on the target Intergraph platforms. A painstaking manual process gradually “decimated” these point data. The result was 10 separate models of each stone, the level of detail on each chosen to correspond to a variety of end user viewing distances – the further away, the lower the level of detail. At run-time the software selects the 5 most appropriate levels of detail, based on the characteristics of the computer being used.
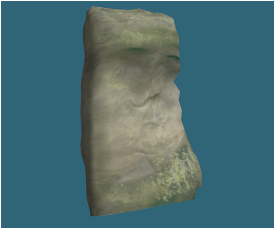
One from each of a stereo pair of photographs was then digitised, processed and texture mapped onto the geometry of the relevant stone. Even small surface features such as cracks, lichens and fungi are clearly visible. The full version of the Stonehenge model requires 80 Mb of texture RAM. Lower resolution versions (26 Mb and 8 Mb have, however, been produced). Stonehenge’s virtual landscape was created from digital topographic information derived from aerial photography and boasts all the features contained within the real area – barrows, ditches, roads, the Avenue and the current Visitors’ Centre. In geometric terms, the entire model contained 50,000 polygons – 40,000 of these described the stones and immediate terrain, the remaining 10,000 occupying the more distant terrain (area: 2.5 x 2.5 kilometres).
Other historical features – ditches, banks and the like have been geometrically exaggerated, otherwise they would not be visible to the user when at normal eye height in the virtual world. It took four developers six months to complete the Project. Virtual Stonehenge was launched at the London Planetarium on June 20, 1996, a few hours before the actual Summer Solstice. Following a description of the Solstice by the renowned astronomer and celebrity Patrick Moore, English Heritage’s Chairman, Sir Jocelyn Stevens, donned a VR headset and set off to explore Virtual Stonehenge, pausing to view the night-time sky (see below), the real-time sunrise (see below) and to remove all 20th Century, man-made artefacts, returning the site to a near-“virgin” condition, as is planned for the year 2000.
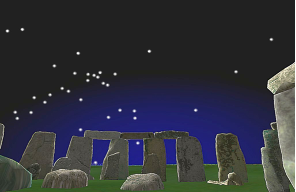
Astronomical Mapping. The basic source data for the star positions were originally downloaded from the Internet using Right Ascension and Declination for stars with a greater Apparent Visual Magnitude than 3.55. This form was chosen, as it was not practical to represent the stars according to their “real world” positions (in this case the virtual world would have had a bounding box measured in light years!). Right Ascension is measured in hours (24) and had to be converted to degrees, and Declination was measured in degrees (-90o to +90o). These can be thought of as the longitude and latitude lines that span the Earth. The star positions were then projected onto a sphere surrounding the Stonehenge model from the celestial equator (ie. centre of the earth). Once the stars were spherically projected, they were scaled according to their Apparent Visual Magnitude. The position of Stonehenge from the centre of the Earth then had to be taken into consideration as the “star sphere” was being projected from the celestial equator. This involved shifting the whole star sphere and then spinning the sphere around an axis close to the North Star.
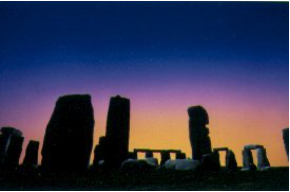
Sunrise Effect. Various methods of achieving a real-time sunrise effect were discussed. It was decided that a method based on using smooth shaded ellipses would take full advantage of the Intergraph hardware and Sense8’s WorldToolKit. For the sunrise effect to work, there were two objects primarily interacting with each other – the hemisphere surrounding Stonehenge (the sky) and a “virtual” sun. The sun had various parameters which could be set. The actual sun object can be thought of as a number of bands of differing circumference (each representing a different fixed colour) centred around a point. If one imagines a point travelling from the centre of the bands to the outside, the colour of the point would then gradually change. If the distance between bands is increased and the point is travelling at the same speed, then the perceived change in colour be would less obvious. This is useful when one wishes to fade gradually from night to day over a long period, and for the extreme effects when the fade changes from red to yellow over very short distances. The interpolation between the different colour bands was computed and stored in a colour look-up table to optimise execution time. Each point in the hemisphere (sky dome) was individually coloured according to its distance from the sun. This was achieved through interaction between the sun object and the sky dome. The virtual sun was initially placed at its furthest band distance from the dome and then gradually moved inwards. This created the essence of the sunrise effect. To enhance the effect of a genuine sunrise further, the spheres (bands) were changed to ellipses, thus recreating the atmospheric refraction that is seen on Earth. Through the use of an ASCII text file, the developers were then allowed to experiment with various parameters for each band (eg. the number of band, the colour, individual radii, the number of colour interpolations and the three dimensional elliptical shape used). By using this method it meant the demonstration takes advantage of Gouraud shading, thereby using a minimum amount of texture memory and keeping run-time efficiency at an optimum level.